


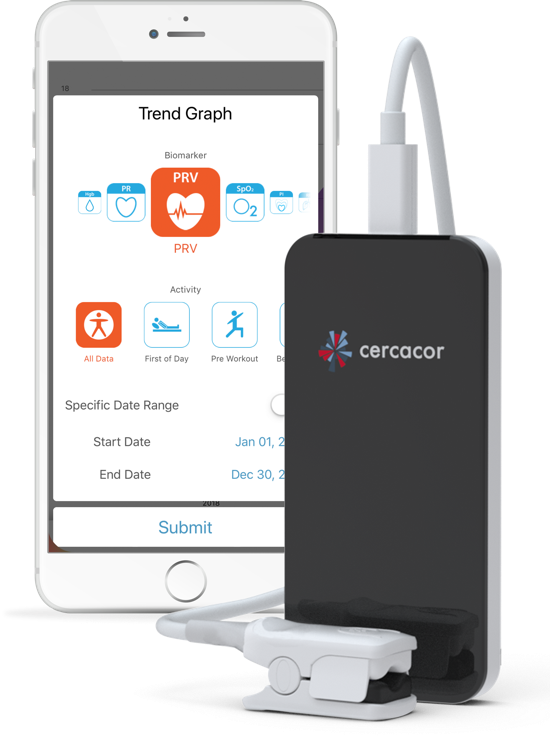
Features
Parameters Measured
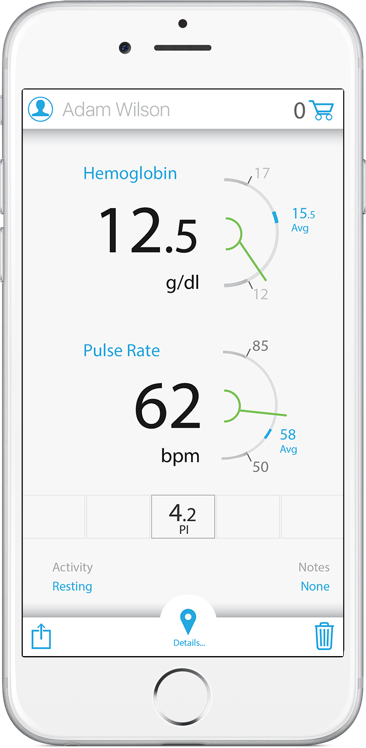
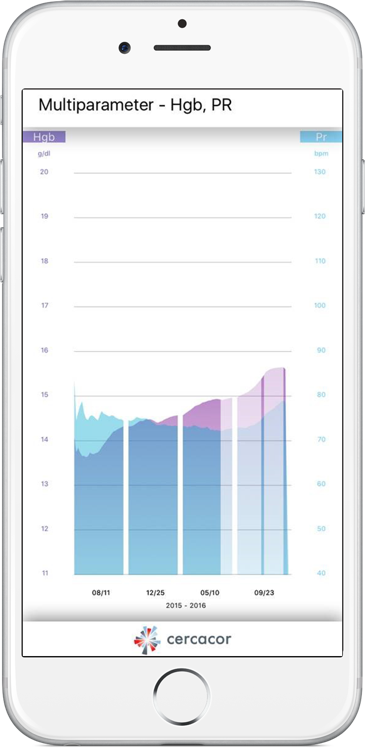
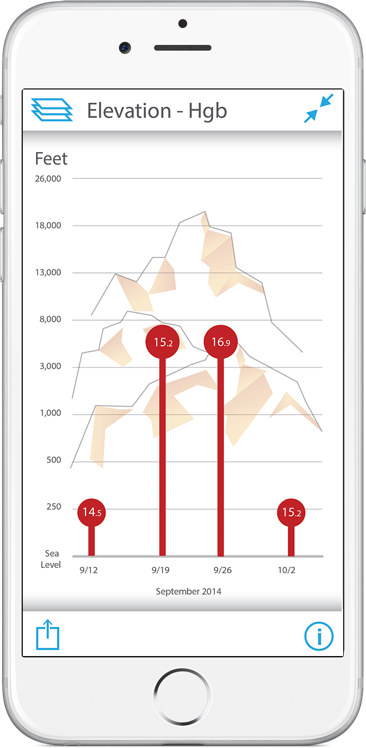
 Hemoglobin
The protein contained in red blood cells that is responsible for delivery of oxygen to the tissues. The range of hemoglobin values can vary based on your age and biological sex. For adults 18 years and over at rest, hemoglobin values can be between 12-15.5 g/dl for females and 13-17.2 g/dl for males.
Why measure?
Tracking your Hgb first of day and Pre/Post specific activities such as workouts or hydration may help you understand the intensity of your workouts and the fluid volume shifts and/or recovery times. Additionally, you may be able to learn the extent to which elevation training increases your Hgb and how long the effect lasts after returning to sea level.
 Pulse Rate Variablity
PRV is a measurement of the variability in time between successive pulse rates and corresponds to the body’s ability to adapt to different physiological or environmental stimuli. A higher PRV score means that there is more variability in the time periods (which is a good thing) and a lower PRV score means that there is less variability. As such, PRV has become a useful tool in understanding the athlete’s adaptation to training load and recovery. Values in the range of 20-70 are considered normal for healthy adults.
Why measure?
PRV is helpful in understanding the body’s adaptation to training load and recovery. Once a baseline PRV value is established, upwards trends in PRV value generally indicate increasing fitness/adaptation to a training load, whereas downward trends in PRV, generally indicate that the body is in need of rest and recovery.
 Oxygen Content
The total amount of oxygen bound to hemoglobin. This value is derived from your hemoglobin and oxygen saturation levels in millilitres per decilitre of oxygen (ml/dl). At rest values can range between 15.2 - 23 ml/dl. By tracking this number with Ember, you may discover that you have better endurance and performance when your OC is trending higher. OC values only display with measurements that used hemoglobin credits.
Why measure?
By tracking this number with Ember, you may discover that you have better endurance and performance when your OC is trending higher. If you are significantly below your 30 day average for OC then you may not be fresh enough for a personal best.
 Carbon Monoxide
A measure of the percent (%) of hemoglobin that is bound to Carbon Monoxide in arterial blood and unable to bind oxygen. Non-smokers should have less than 2.3% while heavy smokers (> 2 packs a day) may be as high as 9%.
Why measure?
CO levels as high as 4% can cause significant reduction in exercise performance. Tracking your CO values can help you see how changes in location or behavior can help minimize CO exposure and maximize your body’s oxygen-carrying capacity.
 Methemoglobin (Met)
A measure of the percent (%) of hemoglobin that is in the oxidized state (Met) in arterial blood and unable to bind oxygen. Met values can normally range between 1 – 1.5 %.
Why measure?
Met can accumulate as a result of diet high in nitrates or nitrites or strenuous exercise. Tracking your Met values can help you see how changes in diet or exercise routine can help minimize Met and maximize your body’s oxygen-carrying capacity.
 Pulse Rate
The number of beats your heart takes per minute (bpm) as detected from the pulsation at your finger tip. At rest values range between 50-85 bpm however fit individuals typically have lower resting heart rates. This is because their heart is more efficient and effective with each beat that it requires fewer beats per every minute.
Why measure?
Tracking your pulse rate first of day and pre and post work out is a great benefit of using Ember to get an understanding of the intensity of your workouts as well as the impact over time to your fitness level on your first of day pulse rate.
 Perfusion Index
The ratio of pulsing blood to the non-pulsing blood in your finger and is used to indicate the strength of blood flow to your finger. Ember can measure a range from 0.02 to 20%.
Why measure?
The higher the number, the stronger your blood flow. You may see low perfusion index numbers when you have cold hands.
 Oxygen Saturation
The amount of hemoglobin that is saturated with oxygen expressed as a percentage (%). At rest you should be greater than 95% oxygen saturated and after an intense workout you may go less than 85%.
Why measure?
The lower your SpO2 the less effective your muscles and tissues are for performance. Tracking your SpO2 with specific activities throughout the day with Ember may help you understand the quality of your oxygen exchange.
 Respiration Rate
The number of respiratory cycles you complete per minute (rpm). A respiratory cycle is the entire inhalation (breathing in) and exhalation (breathing out) from your lungs. Values can range from 15-20 respiratory cycles at rest.
Why measure?
Tracking your RR multiple times per day with Ember may help you understand the impact exercise has on your respiratory cycle and provide feedback on how effective your breathing becomes over time.
 Pleth Variability Index
PVI is the variation in perfusion index over your breathing cycle. Changes in PVI may indicate changes in hydration, breathing effort, perfusion, or other factors.
Why measure?
It is suggested to measure PVI in the same body position, remaining still and without talking, at the same breathing rate and depth of breathing. An increase in PVI may indicate a decreased level of hydration, increased breathing effort, or other factors. A decrease in PVI may indicate an increased level of hydration, decreased breathing effort, or other factors. Multiple factors other than hydration and breathing effort can affect PVI, including breathing rate, depth of breathing, body position, body movement, vascular tone, blood flow to the finger (perfusion index), normal variation within a short-term monitoring session, waveform shape changes, and/or cardiovascular abnormalities.